







Prior to this past season, St. Louis Cardinals 33-year-old utility man Matt Carpenter garnered more appreciation in sabermetric circles than traditional circles because of his enhanced plate discipline and tantalizing Statcast metrics.
But midway through 2018, Carpenter’s latent power potential finally manifested, and he became a household name. He finished the season with career highs in home runs (36), slugging percentage (.523), and OPS (.897). Better yet, his .386 xwOBA outpaced his .375 wOBA, indicating that his box score stat line was legitimately earned. Heading into 2019, Carpenter is finally garnering the respect he deserves.
Unfortunately, some concerning headwinds are brewing. For starters, Carpenter’s approach at the plate is very one-dimensional, heavily reliant on turning middle fastballs into pulled fly balls at the expense of performance on breaking pitches. This unilateral approach makes Carpenter a very streaky hitter — when things are on, he can hit 11 home runs in one month (July 2018), but when things go bad, he’ll ground into the shift once per game and post a .245 slugging percentage (September 2018).
This strategy has worked for Carpenter to date because the feasts have been bigger than the famines. But one of the reasons the feasts have been so big is that opposing pitchers have employed a completely inappropriate plan of attack against Carpenter to date, essentially pitching to his strengths rather than his weaknesses.
Dropping Heat
Despite being one of the best fastball hitters in the game, pitchers groove the hard stuff to Carpenter like he’s a standard weak-wristed leadoff hitter as opposed to one of the game’s best power hitters. Don’t believe me? Take a look at the hitters who faced the highest rate of fastballs in 2018:
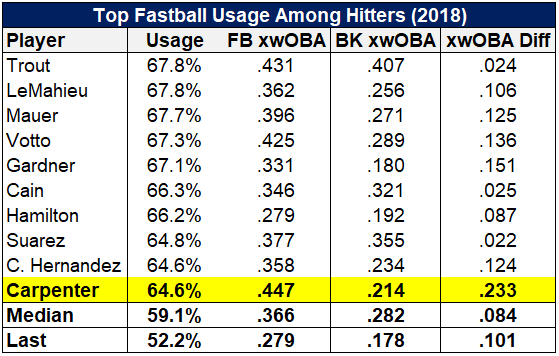
The majority of this list is composed of contact-oriented leadoff hitters such as DJ LeMahieu, Brett Gardner, Lorenzo Cain, Cesar Hernandez, and Billy Hamilton. Pitchers aren’t afraid of throwing fastballs to these hitters because they are rarely capable of doing serious damage.
While there are a handful of good power hitters represented, such as Angels center fielder Mike Trout and Reds third baseman Eugenio Suarez, they are also adept breaking-ball hitters, indicating that pitchers wouldn’t necessarily derive any benefit from throwing them fewer fastballs.
Then we have Carpenter, slotting in 10th at 64.6% fastball usage. He demolished those fastballs, earning a .447 xwOBA on them. That performance made Carptener the best fastball hitter on the list and the sixth-best in all of baseball this past season. His fastball dominance also extends back multiple seasons, with .440-plus xwOBA readings on them in both 2016 and 2017.
The striking thing about Carpenter seeing so many fastballs isn’t just about how much he destroys them. It’s also about how bad he is on breaking pitches. Carpenter’s .214 xwOBA on curves and sliders in 2018 was in the bottom 10th percentile in MLB this past year. Based on the absurd 233-point xwOBA differential on fastballs and breaking balls, it seems like pitchers would derive a serious benefit by throwing Carpenter more of the bendy stuff.
The league median fastball usage rate is 59.1%. The hitter who saw the least amount of fastballs in 2018 was Cubs star Javier Baez at 52.2%, and Baez was a significantly better breaking-ball hitter than Carpenter this past season. I’m not sure what the ideal fastball usage rate for Carpenter is, however, I have to suspect pitchers will begin to wise up to the fact that pitching to Carpenter isn’t like throwing to Hamilton.
Down the Middle
We just established that Carpenter is profiting from a significant arbitrage opportunity: MLB pitchers throwing a pitch mix that treats him like a standard 1980s leadoff hitter. But astonishingly, the lunacy doesn’t stop there. It turns out that pitchers have been throwing Carptener fastballs in exactly the areas where he is most adept at hitting them.
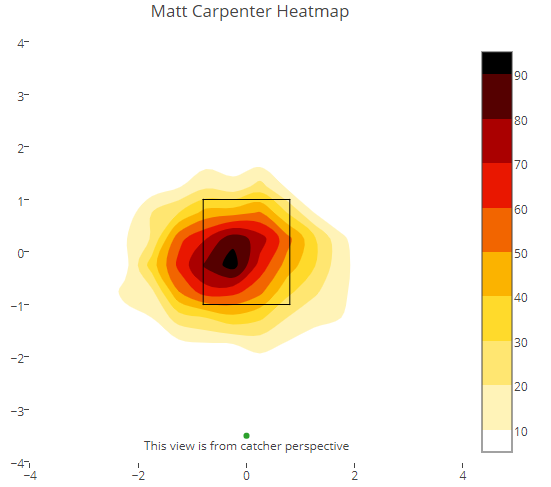
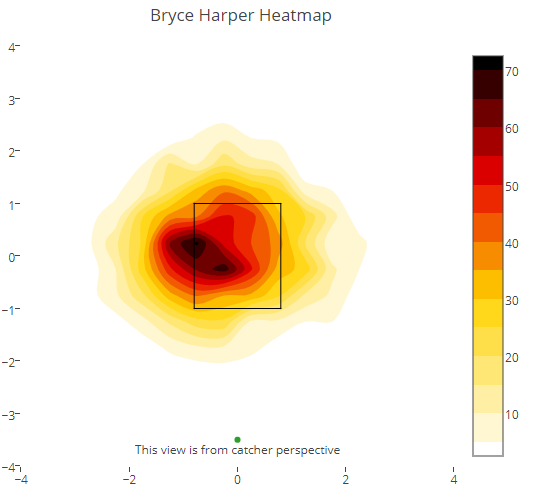
Two heatmaps are outlined above. The one on the left displays the typical locations of fastballs thrown to Carpenter in 2018, while the one on the right outlines those witnessed by Bryce Harper. Not only does Carpenter face nearly 7 percent more fastballs than Harper (64.1% vs. 57.7%), pitchers tend to groove those fastballs right down the middle. Carpenter saw 141 fastballs thrown down the heart of the plate in 2018. Despite seeing more overall pitches, Harper only witnessed 91.
Unsurprisingly, Carpenter inflicted most of his damage on these pitches. His top exit velocities on fastballs sat dead center (95.9 mph), low-center (96.2 mph) and left-center (95.1 mph), the precise areas that overlap with the darkest areas of his fastball usage heatmap.
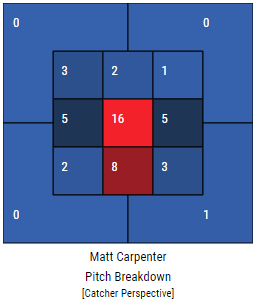
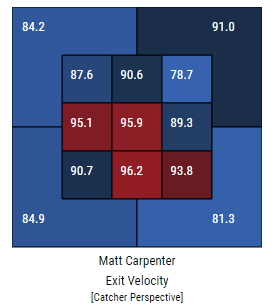
Carpenter barreled 55 total balls in 2018, with 46 (84%) off fastballs. Of those 46, nearly two-thirds were struck in Carpenter’s “happy zones” described above. Note that Carpenter seems to struggle with elevated fastballs, evidenced by his tepid exit velocity and barrel metrics in the upper third of the zone. If pitchers are still content to throw Carpenter an endless sea of fastballs, the least they could do is place them in the areas where he has a more difficult time hitting them.
Why?
You might be left wondering how this is possible. Carpenter has established himself as a top power bat, yet pitchers are still throwing him his favorite pitches in his favorite parts of the zone. In this era of information, that should not be happening.
Carpenter took 77% of his plate appearances last season from the leadoff spot. Could it be that, despite modern advancements in analytics, MLB pitchers still treat leadoff hitters like they’re all slap hitters? Based on the other names who face a disproportionate share of fastballs — LeMahieu, Gardner, Cain, Hernandez, and Hamilton — it certainly seems that way.
Some might argue that Carpenter, based on his 15%-plus walk rate, is patient enough to make pitchers throw him the pitches he wants. While that argument makes a degree of intuitive sense, it isn’t borne out by the pitch mix experienced by other patient power hitters.
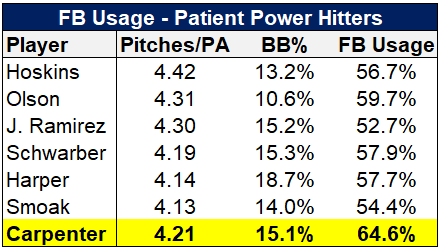
Based on the above sampling, there is no discernible direct correlation between a hitter’s patience at the plate and the number of fastballs he sees. Carpenter’s 64.6% fastball rate stands out like a sore thumb, with his leadoff status the likely culprit.
What It Means
The fact that Carpenter’s performance has been propped up by a pitching strategy that plays directly to his strengths should make the Cardinals and fantasy owners a bit nervous heading into 2019. Carpenter is a poor breaking-ball hitter and is also bad at hitting high fastballs. If opposing pitchers begin to adapt and either throw him fewer overall fastballs or become more refined with their location (or both), then Carpenter will have to make some serious adjustments to maintain his batting performance.
Whether pitchers do adapt is the $10,000 question. There seems to be a big arbitrage opportunity right now in batting a power-hitting, fastball-loving hitter in the leadoff spot. However, I can’t imagine that this scenario persists, as teams are giving away too many easy pitches to hit to power hitters such as Carpenter. Once that happens, the onus will be on Carpenter to respond.
(Photo by David Berding/Icon Sportswire)
